LeanOps™ Production Reporting Program


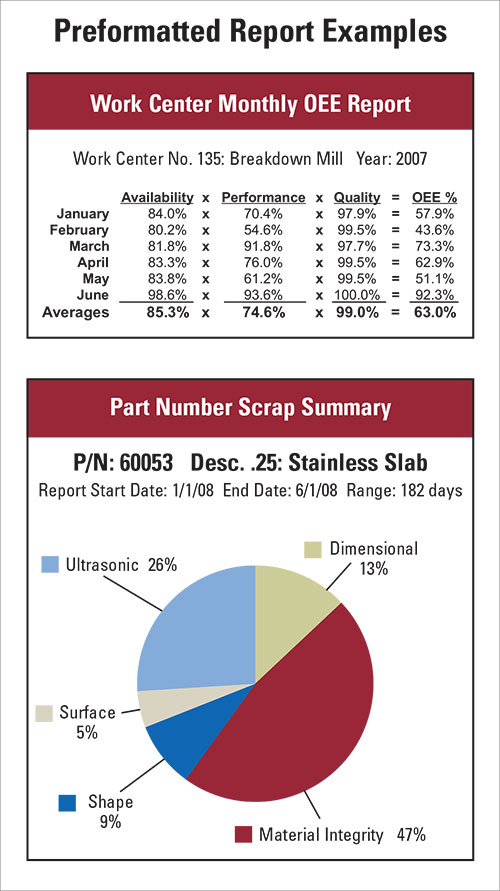
LeanOps™ is a production reporting program that connects you to shop floor productivity data with easy-to-read charts and graphs.
Moreover, this Microsoft™ Access® program generates over 35 reports on key performance indicators. It efficiently aids managers and engineers in maximizing ROI through an activity-based costing approach, enabling them to identify and prioritize cost-reduction opportunities. LeanOps™ suits small-to-medium-sized companies eager to enhance shop floor tracking beyond Excel spreadsheets.
Contrastingly, LeanOps™ does not mimic a traditional ERP system; it omits scheduling and inventory tracking. Instead, it zeroes in on performance metrics such as downtime and scrap costs, functioning either as a standalone application or alongside existing ERP systems. Some reports may duplicate ERP data, covering areas like operator efficiency and part costing.
LeanOps™ offers five implementation levels to fit various manufacturing needs. Users can monitor equipment downtime and throughput or extend tracking to include operator and product efficiency. The top tier, Level 5, incorporates part numbers and production standards, allowing for electronic table maintenance to reduce labor costs.
Why use LeanOps™? – LeanOps Productivity Reporting Program
- Increase throughput, profit margins and operator efficiency.
- Decrease operational costs, downtimes, lead times and risk.
- Concentrate resources on the top Pareto Analysis downtime opportunities or scrap causes.
- Quick access to standardized reports for operation managers, plant managers, and supervisors.
- Standardized reports to benchmark and track the impact of cost reduction projects at the plant level, work center level, and part number level.
- Benchmark your operational performances with quantitative values.
- Short Return-On-Investment (ROI)
- Multiple-level implementation based on operational need and availability of funds.
- Establish accurate part costs based on actual throughput rates.